Costa Express · Retail · Kiosk
Touchscreen ordering for self-serve coffee machines
I led the redesign of touchscreen ordering on Costa Express, Costa Coffee’s self-serve machines.
- Role
- Lead Product Designer
- Team
- Product owners, product managers, stakeholders, data analyst, developers, QA, project manager
- Platform
- Touchscreen kiosk: three machine versions with different screen sizes
- Users
- People buying coffee on the go, with no staff to help
Overview
Challenge. The old interface looked dated. Popular drinks took as many taps as anything else on the menu, cold drinks were hard to find, customizing was clumsy, and the waiting screen showed a fake progress bar.
My role. I led the redesign: research, concepts, three rounds of remote testing, in-person sessions with customers, a design system for three screen sizes, and the switch to Costa’s refreshed brand.
Outcome. Orders got 15% faster, more people customized their drinks and basket size went up. Before the wider rollout, the new interface ran as a pilot on some of the machines.
Context
Costa Express is Costa Coffee’s self-serve format. You order on a touchscreen, and the machine makes a barista-style drink from freshly ground beans and fresh milk, with no staff involved. The machines stand in convenience stores, fuel stations and travel hubs, and site owners get a share of the revenue. So order speed and order value matter to them as much as to Costa. We wanted the interface to feel closer to a coffee shop than to a vending machine, and to work on the first try for someone in a hurry.
How ordering works
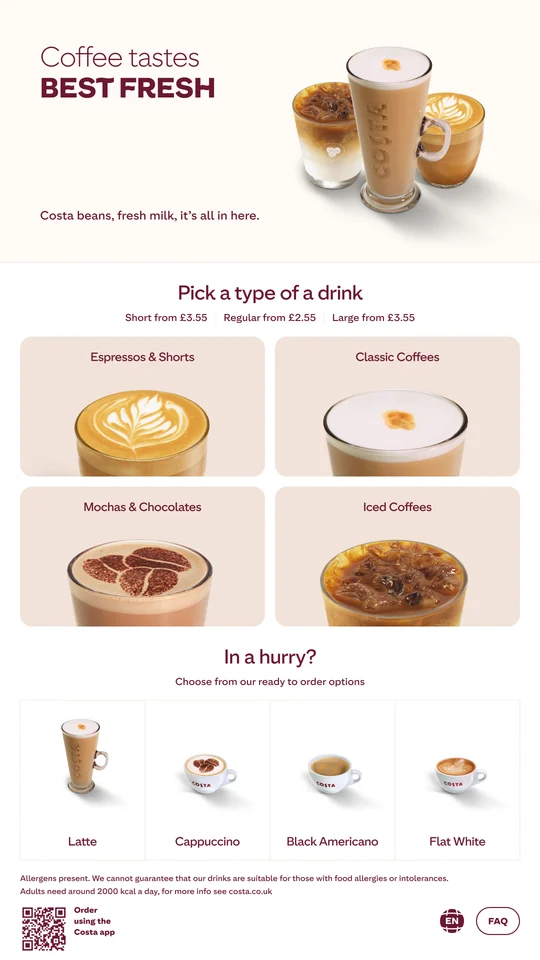
- Home: drink categories and a quick-order row of popular drinks.
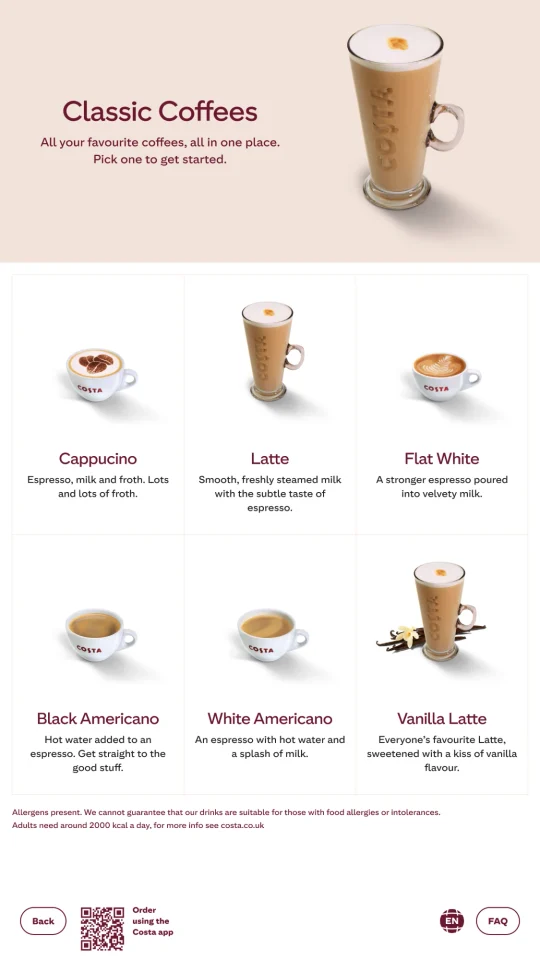
- Category: drinks with short descriptions.
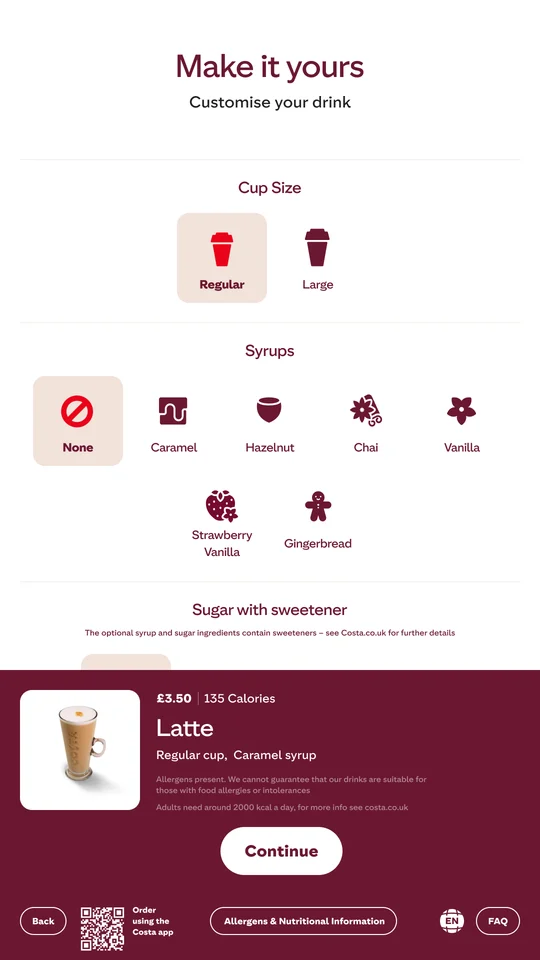
- Customize: size, syrups and sugar, with live price and calories.
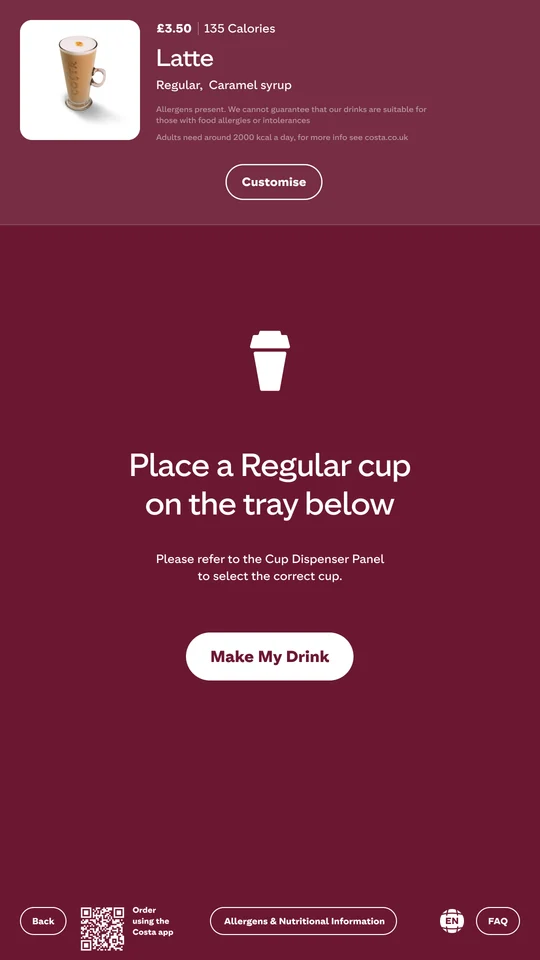
- Place cup: which cup to use and one button to start.
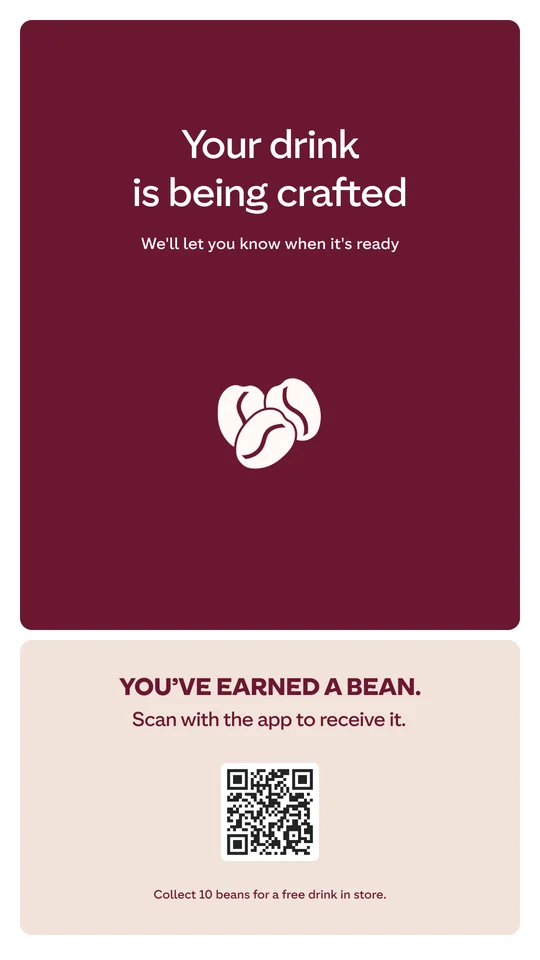
- Crafting: a looping animation while the drink is made.
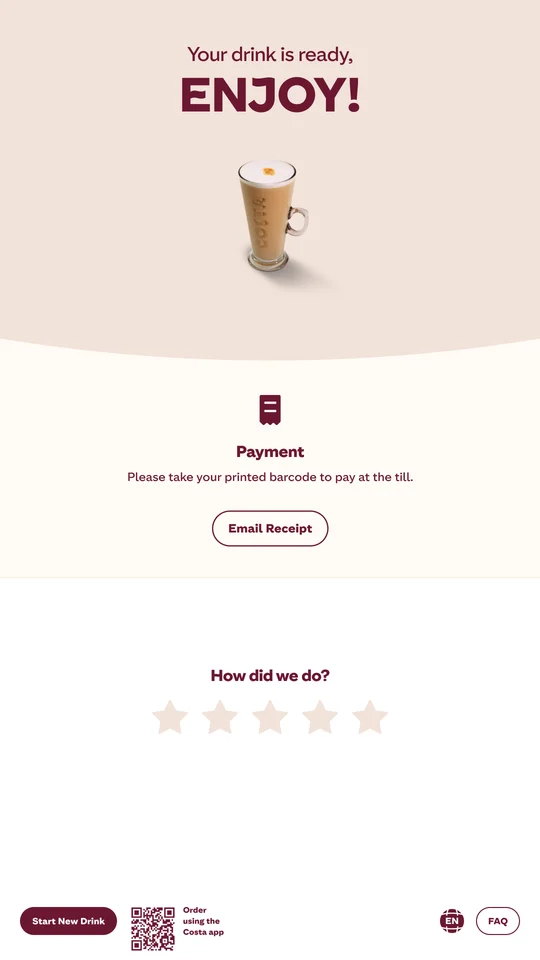
- Ready: payment instructions, receipt and a quick rating.
A shortcut for regulars
Most people order one of a few popular drinks, but every order went through the full menu. Cold drinks hid behind a toggle that confused people in testing.
What changed
- Added an “In a hurry?” row with the most popular drinks, ready to order straight from the home screen.
- Regrouped the menu into four sections: Espressos & Shorts, Classic Coffees, Mochas & Chocolates and Iced Coffees. Iced drinks finally got a visible section of their own.
- Put starting prices for each cup size on the home screen.
Quick order does add a second path to the home screen. We kept it to four drinks. The menu doesn’t get crowded for everyone else.
One screen for customizing
Customizing was clumsy, so people often skipped it. The business wanted more customized drinks, and customers just wanted their coffee fast.
What I did
- A single “Make it yours” screen with cup size, syrups and sugar all visible at once. Defaults are preselected. A plain drink needs no extra taps.
- A summary panel that stays on screen and updates price and calories with every choice.
- Add-ons offered right in the customization step, where they feel like part of making the drink.
- Allergen and nutrition information one tap away.
Trade-off. More options usually slow ordering down. With the defaults already chosen on one screen, people in a hurry can skip it.
The waiting screen
The machine can’t tell the interface how long a drink will take. The old screen showed a fake loader anyway, and it ran the same for an espresso and a latte.
What I did instead
- Replaced the fake progress bar with a looping animation of spinning coffee beans. It shows the machine is working without promising a time.
- Set expectations in the copy (“We’ll let you know when it’s ready”) and followed it with a clear ready screen.
- Used the wait for a loyalty prompt: scan a QR code and collect a bean in the app.
- Tested the animation together with the rest of the flow in the prototype rounds.
Why a loop. A progress bar sets an expectation. If it fills up before the drink is ready, or gets stuck, people start to think the machine is broken. A loop doesn’t have that problem. The beans also fit Costa’s “real beans” message.
The downside is that there’s no time estimate at all.
Research and validation
Site owners. They watch customers use the machines every day, and their feedback gave us the first list of problems.
Baseline. Before changing anything, the data analyst and I measured the old interface: time to order, drop-off at each step, how often people customized and basket size.
Concepts. We brainstormed with stakeholders, product managers and the data analyst and went through several concepts before choosing one.
Remote testing. Three rounds of task-based tests on UserTesting, with timing and comments. Each round turned up navigation problems, and after each one we made the key elements more obvious.
In person. A research agency brought in 5 real customers to test the Figma prototype at the head office, on a screen identical to the machines’. We did interviews, card sorting and usability tasks.
Pilot. The new interface ran on some of the machines, with analytics, before going wider. Customers and site owners gave positive feedback.
Design system and delivery
- One design system for three machine versions with different screen sizes. Every screen was built from it.
- Costa refreshed its brand in the middle of the project, and I moved every screen to the new colors and styles.
- All payment options covered: card, contactless, and paying at the till with a printed barcode.
- Outside the machines, I also redesigned the business section of Costa’s website for B2B partners and franchise inquiries.
Metrics
The key metric is start-to-paid conversion: with no staff at the machine, every abandoned order is a lost sale.
+5 pp
Started orders that reach payment
An “In a hurry?” row and a single “Make it yours” screen
−43%
Back taps per order
Cup size, syrups and sugar visible at once
+4 pp
Orders with a larger size or an extra
Add-ons offered right in the customization step
pp: percentage points. Guardrail: the rebrand must not worsen time to order or conversion by more than 1 point.
What I’d do differently
Our final tests ran in an office, on a screen identical to the machine’s. Next time I’d test at real sites much earlier. Glare, queues and noise change how people use a kiosk, and an office can’t really recreate that.